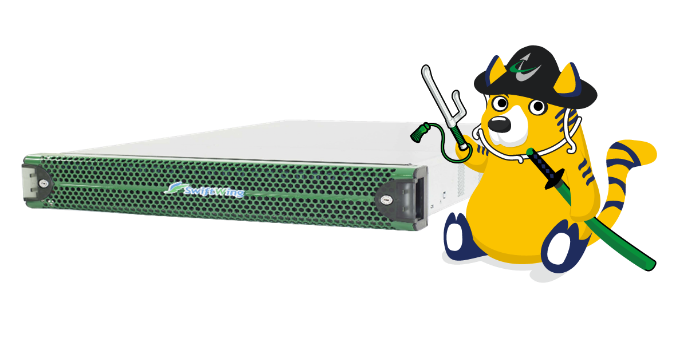
SwiftWing Traemon

SwiftWing Traemon
SwiftWing Network Monitoring & Capturing Network AnalysisReal-time Network Analysis and Visualization (DPI)

Originating from Ota, Tokyo, the SwiftWing Series has enjoyed great success since its introduction in 2003. We have a track record of 20 years of development, a worldwide customer base, and sustained operational performance.
SwiftWing Traemon is a system providing real-time analysis and visualization of network traffic. It excels at identifying unauthorized communication and isolating flaws in the network.
Not only does it support TCP/UDP flow analysis, it can perform more advanced analyses – such as visualization of service usage trends and detection of abnormalities - by measuring HTTP response time (TAT) and analyzing HTTP metadata.
Traemon examines network status extensively and comprehensively, employing over 60 charts to help users visualize data about service usage traffic, TCP connection quality, TCP transfer quality, HTTP response time, HTTP metadata, etc.
When deployed in coordination with Sirius NDR, the analysis results obtained from Traemon can be used as a filter to extract network packets (captured by Sirius NDR) that are of interest to users.
Advanced DPI Analysis
TCP connection quality and transfer quality analysis
- 3-way handshake response time
- Number of retransmissions during 3-way handshake
- Round trip delay time (RTT)
- Zero Window occurrences
- Number of packet loss sessions
- Number of retransmissions during TCP establishment
HTTP packet and metadata analysis
- Request method
- Request URI
- Host
- Referer
- User-Agent
- Response time (TAT)
Visualize Network Traffic through Graphs
Choose from a selection of over 60 types of graphs to be displayed on the dashboard. Each graph is updated in real time and can track data over a configurable period (1 hour / 6 hours / 1 - 30 days)
Communication Delay Time Validation
- TAT by HTTP method and metadata
- TCP 3-way handshake (SYN/ACK) TAT
- TAT during TCP session establishment
- TCP TAT by IP address prefix
Suspected location of packet loss is estimated from the number of TCP packet retransmissions and the direction of occurrence.
Count the number of RSTs and RTTs observed for each traffic direction to help identify the location of failure.
| Model | 2 Gbps | 10 Gbps |
|---|---|---|
| TRE-1US-2XGi-2G-8T | TRE-1US-2XGi-10G-8T | |
| Supported Interfaces | fbC2XGhh - 10M/100M/1G/10G I/F x2 ports
10Base-T |
|
| Dimensions (W:H:D / mm) | 437 x 43 x 650 | |
| Weight (kg) | 17 | |
| CPU | Dual Intel Xeon | |
| Memory | standard 128 GB | |
| Storage | 8 TB (SSD) (expandable) | |
| Power | Voltage: AC 100V - 240V Wattage: ~250W |
Voltage: AC 100V - 240V Wattage: ~250W |
General Network Usage
 |
 |
Network Quality Monitor
 |
 |
 |
 |
HTTP Monitor
 |
 |
 |
 |
Other
 |
SwiftWing Traemon can be used in conjunction with our network drive recorder, Sirius NDR.
With just a few mouse clicks, the analysis results produced by Traemon can be forwarded to Sirius and used to extract relevant packets captured and stored in the latter device.
Procedure
1. Select the conditions to be used for packet extraction from Traemon analysis results
2. Transfer filter conditions directly to Sirius NDR (synchronized with Traemon) and perform extraction (quick post-filter function)
3. Press the "Filter" button and download the extracted PCAP file


